01 / ONE ATMOSPHERE
Emissions travel
Atmospheric transport can carry pollution across borders. Evaluate global climate effects and local exposure separately.
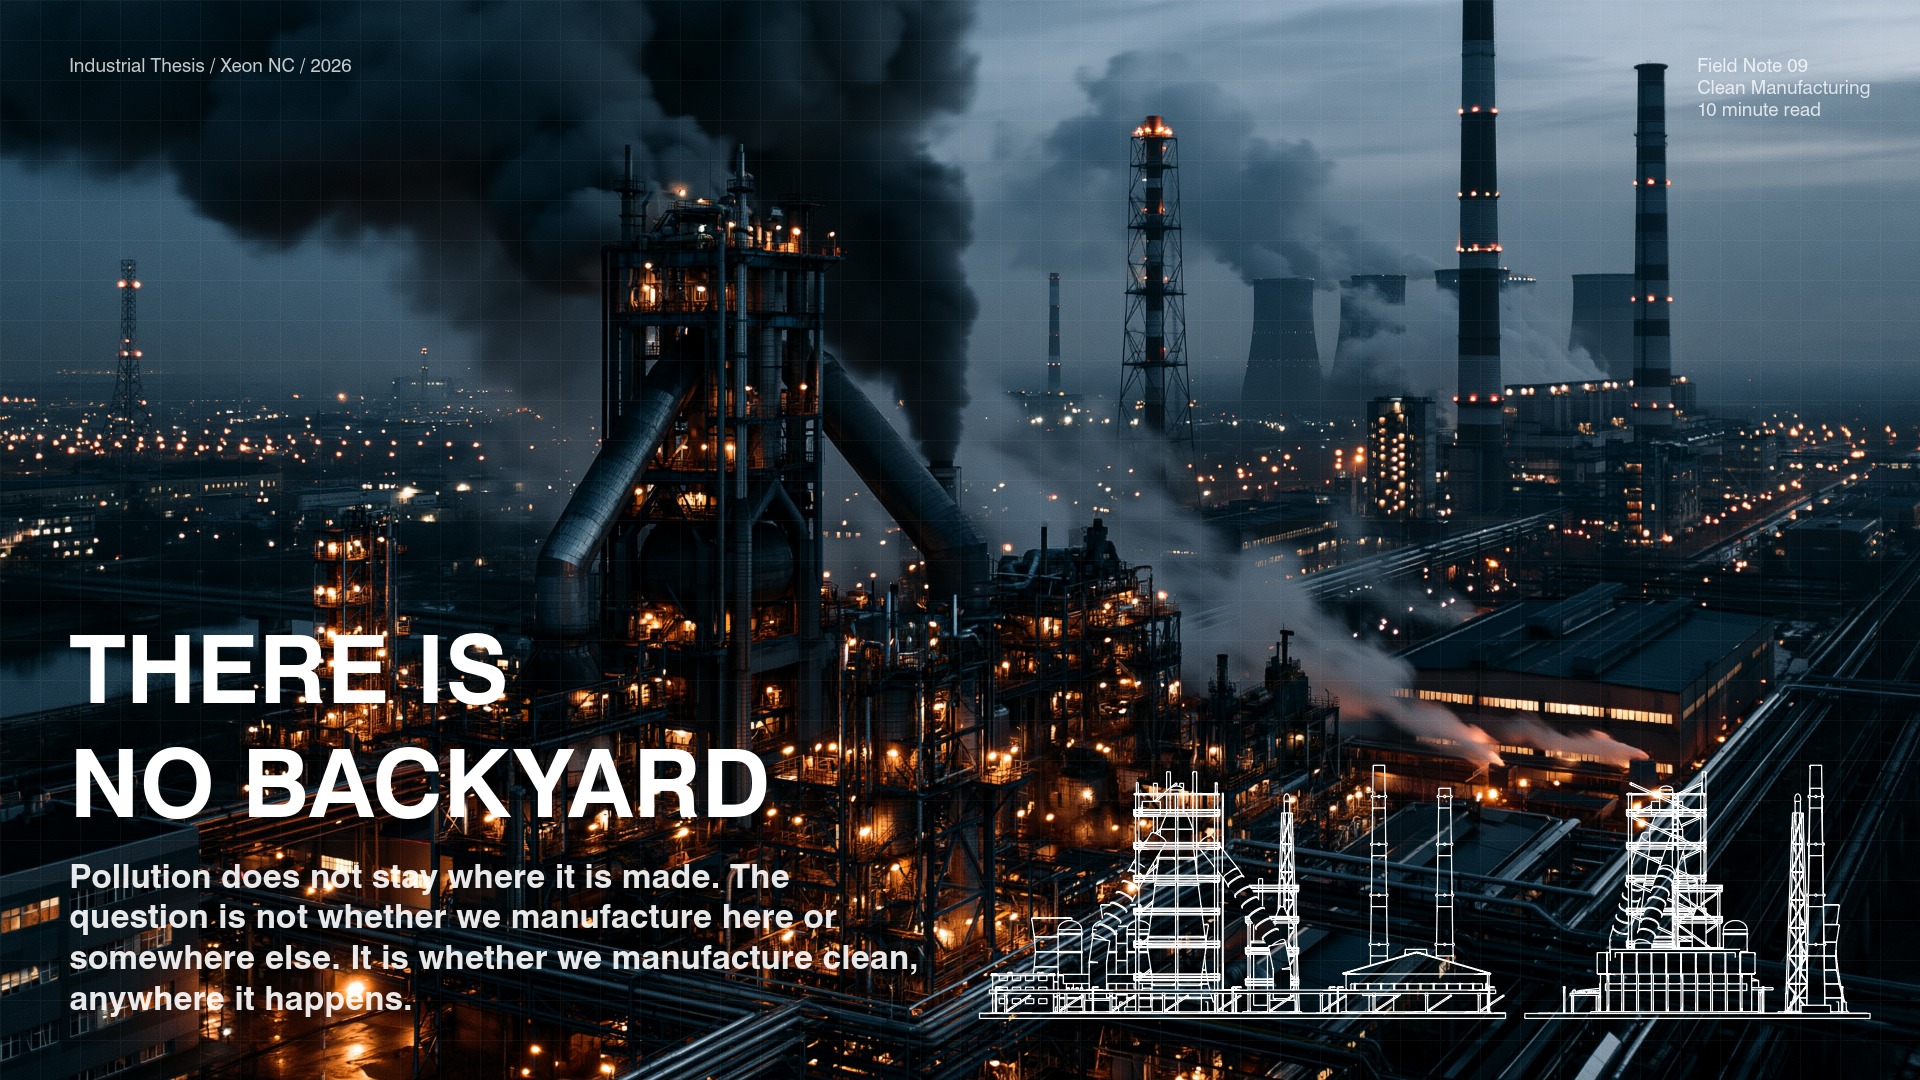
Pollution does not stay where it is made. The question is not whether we manufacture here or somewhere else. It is whether we manufacture clean, anywhere it happens.
Atmospheric transport can carry pollution across borders. Evaluate global climate effects and local exposure separately.
Connect material, energy, process losses, and freight to an equivalent accepted part.
Require traceable records and a defined response when production falls outside specification.
Cleaner manufacturing is a set of equipment, energy, material, and process decisions. It can be built.
A sourcing decision changes the location of production. It reduces emissions only when it changes the physical system that produces and delivers the part.
That system includes the mill, feedstock, furnace, electricity supply, fabrication process, material losses, and freight. A purchase order connects those operations commercially. An emissions assessment must connect them physically.
When a factory closes and its output is replaced by imports, emissions can disappear from one jurisdiction's inventory while remaining in the supply chain. The inventory and the product footprint answer different questions. A decline in the first does not establish a reduction in the second.
The case for domestic manufacturing is strongest when proximity becomes operational control: access to production records, direct coordination with suppliers, and the ability to investigate deviations. Those advantages have to be converted into measured performance. Location alone cannot do that work.

An administrative boundary defines reporting responsibility. Atmospheric transport follows wind fields, chemistry, and deposition.
Emissions have different spatial and temporal effects. Particles can be transported downwind, transformed, or removed from the air. Exposure depends on the pollutant, release conditions, weather, and distance from the source. NASA describes winds carrying mixtures of Asian dust and pollution toward the Pacific. That transport does not imply uniform exposure everywhere. Source: NASA Earth Observatory.
CO2 requires a different assessment. Its accumulation affects the global climate, and the increase in atmospheric concentration from an emission can persist for thousands of years. The location of release does not confine its climate effect. Source: EPA, Understanding Global Warming Potentials.
Track greenhouse gas emissions across the product system. Assess air pollutants and community exposure at the relevant facilities and locations. A lower carbon footprint does not establish acceptable local air quality.
A territorial inventory assigns emissions to the place of production. A consumption-based account also considers emissions embodied in traded goods.
Neither view is sufficient for selecting a specific supplier. The procurement decision requires a comparison of equivalent products across a consistent boundary: the same material requirements, functional performance, included operations, and delivery point.
Relocation can increase or decrease the resulting footprint. The direction depends on the replacement process, its inputs, and its logistics. Treat a supplier change as a change to the production system, and request evidence for each affected variable.
Verification should be a procurement requirement for every supplier. Record the source, reporting period, methodology, and uncertainty of each emissions value. Where primary data are missing, identify the estimate and its limitations before using it to rank alternatives.

Separate aggregate emissions from production intensity. National output describes the scale of the system; route and product data inform the sourcing decision.
For the aggregate comparison, Global Efficiency Intelligence's Steel Climate Impact 2025 estimates the following annual greenhouse gas emissions for 2023. These are steel-sector estimates, not total emissions from either country.
Source: Global Efficiency Intelligence, Table 2, p. 14. Includes fuel and electricity emissions plus selected coal-mining methane, valued over 20 years (GWP20). Excludes methane from coal used for electricity and from natural-gas supply. The study includes integrated rolling and finishing; these are modeled estimates with defined boundaries, not complete product life-cycle footprints.
China's much larger industry contributes to the gap in annual totals. Those totals do not mean that an individual Chinese sheet has thirty times the footprint of an American sheet. Production volume and emissions per tonne must be evaluated separately.
| Measure | United States | China |
|---|---|---|
| Crude steel output (million metric tonnes) | 81.9 | 960.8 |
| Electric furnace share | 71.3% | 10.6% |
| Oxygen furnace share | 28.7% | 89.4% |
Source: World Steel Association, World Steel in Figures 2026, 2025 output and production-by-process tables. Both countries' process rows are marked as estimates. Furnace shares measure production methods, not pollution. These 2025 figures provide recent context; they are not the denominator for the 2023 emissions estimates above.
Worldsteel's 2024 global route averages, using its expanded greenhouse gas indicator, were 2.66 tonnes CO2e per tonne of crude steel for blast furnace–basic oxygen furnace production and 0.71 for scrap-based electric arc furnace production. The scrap-EAF average was about 73% lower, calculated from those two values. These are global route benchmarks, not U.S. and Chinese national intensities. Source: Worldsteel sustainability indicators, 2024 data.
The expanded indicator includes CO2, methane, nitrous oxide, and upstream mining, using a 100-year warming horizon. Its boundary and time horizon differ from the GWP20 study above. Electric furnaces can use scrap, direct reduced iron, or pig iron; furnace type alone does not establish recycled content or emissions.
Sulfur dioxide (SO2), nitrogen oxides (NOx), and particulate matter require their own comparison. A 2022 study using 2019 data benchmarked steel-industry air-pollutant intensities across 12 countries and regions. China had the highest particulate-matter intensity in that group; the United States was among the lowest for SO2. The analysis included plant emissions and emissions from electricity generation. These are historical findings, not a claim about today's air quality. Source: Air Pollution from Global Steel Industry, pp. 15–18.
The practical implication is that a carbon figure cannot substitute for dust collection, combustion controls, or local monitoring. Cleaner steel must address both its climate footprint and the pollution experienced by neighboring communities.
For sheet metal, ask for the producing mill, furnace route, recycled content, and a product-specific Environmental Product Declaration (EPD), where available. Compare the same grade, thickness, finish, and life-cycle boundary. A national average is context; it is not a certificate for the sheet in your order.
Domestic capacity gives buyers more opportunities to coordinate engineering, inspect production, and resolve process failures. Its environmental value depends on how those capabilities are used.
Industrial capacity also supports continuity of supply and faster iteration. Our articles on reclaiming industrial capacity and manufacturing velocity examine that strategic case. The environmental case requires an additional layer of evidence: which mill supplies the material, how the facility operates, and what happens when performance falls outside specification.
For a U.S. buyer, a domestic production relationship can simplify site access and direct corrective action. Those are practical advantages, not a guarantee of lower emissions. They matter when they shorten the path from identifying a problem to correcting its cause.
A production improvement must change a measurable input, loss, or output while preserving the part's required performance.
Begin with the approved part and its process route. Establish material input, accepted output, electricity and fuel use, consumables, finishing requirements, and rework. These quantities define where the process consumes resources and where an intervention can be evaluated.
Equipment selection is one variable. Utilization, setup, nesting, maintenance, and first-pass acceptance also affect the resources consumed per accepted part. Compare complete operating cycles under representative production conditions.
Link grade, thickness, and finish requirements to mill identity and available product emissions data.
Evaluate electricity, assist gas, cutting time, and rejected parts for the actual material and thickness.
Measure accepted part mass against allocated sheet input. Record reusable remnants and scrap separately.
Include setup, idle demand, tooling changes, and rework when evaluating forming efficiency.
Include pretreatment, coating utilization, curing energy, and waste handling in the process comparison.
Evaluate packaging, shipment consolidation, transport mode, and delivery requirements together.
The control loop is straightforward: establish a baseline, change a defined variable, measure the result, and retain the change only when the evidence supports it. A reduction in cost or cycle time may support the environmental objective, but it does not substitute for measuring it.
For equivalent parts delivered to the same point, report greenhouse gas emissions per accepted part across a stated boundary.
A practical model for procurement includes material production, inbound transport, fabrication, finishing, and outbound delivery. State whether packaging, tooling, waste treatment, and other supporting activities are included. A cradle-to-delivery estimate should not be presented as a complete life-cycle assessment if use and end of life are excluded.
Emissions per accepted part = total emissions allocated to the production lot and its delivery ÷ accepted parts delivered. Within that boundary, account for material losses, rejected work, and rework. State the allocation method for shared sheets, equipment, and shipments.
Connect each calculation to an operating record: material purchases and mill documentation, nesting reports, measured or estimated process energy, finishing consumption, acceptance records, and shipment details. Material certifications establish specified material properties; they do not by themselves establish a carbon footprint.
Xeon NC's role is at the point where a digital part definition becomes a manufacturing instruction.
Material, thickness, geometry, tolerances, quantity, and finish establish the work required. Resolving those requirements before production creates opportunities to improve sheet utilization, reduce avoidable operations, and prevent rework.
Our manufacturing services in Nampa, Idaho, include fiber laser cutting, CNC forming, machining, and powder coating. These capabilities provide specific places to examine resource use: the cutting plan, forming sequence, finish specification, and accepted output.
For a project with an emissions requirement, define the reporting boundary and required supplier evidence during sourcing. A quotation establishes price and scope. A verified footprint requires additional material and process data tied to the work.
Start with the CAD file and the conditions the part must satisfy. Use manufacturability review to resolve production constraints before releasing the order. That is where design intent becomes an executable process.
Upload your CAD files to begin a quote. Include material, finish, and performance requirements so the production route can be evaluated.
Upload Parts & Get a QuoteRelocation changes the production site. The emissions result depends on the replacement process, energy, material inputs, controls, and freight. Compare equivalent products across the same boundary and assess local exposure separately from the global climate footprint.
Wind and atmospheric mixing transport pollutants beyond their release location. Chemistry and deposition affect how far they travel and the resulting exposure. CO2 accumulation has a global climate effect; local air pollutants require location-specific assessment.
Proximity can improve access to production records, engineering coordination, and corrective action. The high electric-furnace share of U.S. steel production also creates sourcing opportunities. Actual performance still requires evidence for the purchased material and production route.
Compare equivalent accepted parts at the same delivery point. State the included operations, allocate material and process inputs consistently, include rejected work and rework, and document the source and uncertainty of emissions factors.
Xeon NC connects CAD requirements with fabrication services including fiber laser cutting, CNC forming, machining, and powder coating. Manufacturability review can identify opportunities to improve material utilization and prevent rework. Project-specific emissions claims require additional material and process evidence.
The smoke was never gone. It was only far enough away that we stopped looking. Bring the work home, and build it in the open.
Start an Instant Quote